The Indicator Dashboard has snapshots that allows you to analyse your Indicators.
The dashboard is made up of two tabs; the Checklist Dashboard and the Question Dashboard.
The Checklist Dashboard focuses on Indicators related to the total checklist score & the Question Dashboard focuses on Indicators related to questions.
To see the dashboard you will need access rights to the Indicators dashboard.
To get started, Click on Dashboards in the menu, and then click Indicator Dashboard
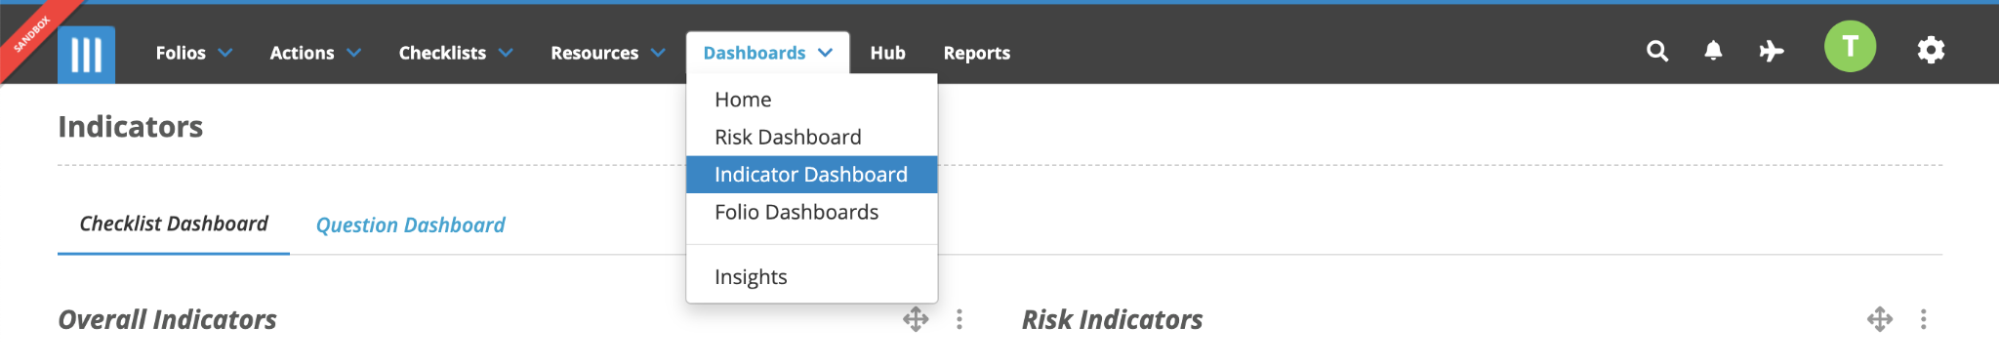
The Checklist Dashboard
The snapshots on Checklist dashboard are:
Overall Indicators
This snapshot shows the number of checklist scores that fall in the Red, Amber or Green thresholds. The snapshot also displays the number of score based checklists that are overdue.
Risk Indicators
This snapshot links score-based checklists to risks. The number of Red, Amber, Green or Overdue Checklists are segmented by the Risk Rating of the Risks that they link to.
Indicators by Business Units
This snapshot shows a breakdown of indicators by Business Unit. Business Unit relates to the Business Unit of the Checklist.
Indicators Trend
The Indicators Trend snapshot shows the trend of Indicators over a period of time. Each line represents a particular Indicator Threshold, hovering over a line will show the number of indicator checklists falling under the indicator threshold in that interval.
Indicators by Template
This snapshot shows a breakdown of Indicators by the Folio Template that the checklist is linked to.
Question Dashboard
All the snapshots above are available on the Question Dashboard. On this dashboard the snapshots focus on indicators at a Question level.
Using the Indicators List
If you click on any of the data points of the snapshots on the indicator dashboard you will be taken to the Indicators List. For example, on the Questions Dashboard if you click on the amber indicator line on the Indicators Trend snapshot shown below which represents 26 amber indicator questions in the 22/23 year.
You will be taken to the Indicators List for these 26 questions and their corresponding scores.
The Indicators List displays key information including questions, a key, due dates, answers, indicators, indicator scores, business units, and linked folios. You can also add columns for evidence, comments, and actions.
Similarly, on the Checklist Dashboard if you click on the red indicator line on the Indicators Trend snapshot shown below which represents 2 red indicator checklists in the quarter of April - June 2021.
You will be taken to the Indicators checklist results which will then display the checklists along with their corresponding scores.